Apryse Innovation Days: Enabling Analytics Tracking and Visualization in WebViewer
By Nikki Manthey | 2024 May 09
5 min
Tags
webviewer
analytics
security
UX
Drumroll, please. The countdown to number one is finally over! If you’ve been following along with our Apryse Innovation Days recap series, you’ve seen how third place winners Team Connect set a new standard for collaboration on 3D files, and how second place team The Integrators successfully integrated LEADTOOLS’ DICOM medical imaging features into Apryse WebViewer.
In this post, we’ll dive into Innovation Days headliner The Hackstreet Boys’ chart-topping project: Apryse Analytics. These talented individuals banded together (pun intended) to enable analytics tracking and visualization functionality in Apryse WebViewer so you can see how users consume and interact with content. This helps businesses make data-driven decisions to optimize documents and provide top-notch experiences.
Let’s learn more!
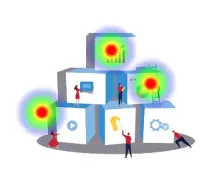
What is Apryse WebViewer?
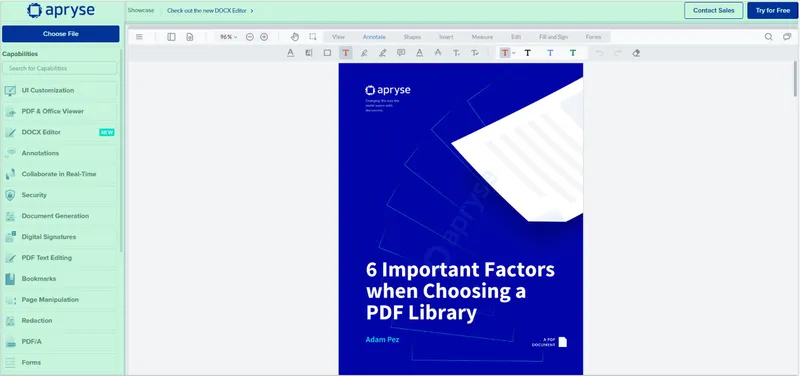
To set the stage for The Hackstreet Boys’ impressive project, here’s a quick rundown of WebViewer. It’s a customizable JavaScript-based document SDK (software development kit) that enables you to view, convert, edit, annotate, and collaborate in real-time on PDFs, documents, images, and more.
Like the name suggests, WebViewer is usually embedded in web applications, so you don’t have to download any extra software to use it. It’s compatible with all developer frameworks and browsers, and supports 30+ file formats.
WebViewer is a powerful and intuitive document collaboration tool, but getting insights into exactly how people interact with those documents either doesn’t exist, or requires a third-party SaaS platform that only provides limited web-based data. That is, until now. Ready to learn about Hackstreet’s hack? Alright!
WebViewer with Analytics: I Want it That Way
Let’s move on to why The Hackstreet Boys created Apryse Analytics for Innovation Days. Current platforms like Google Analytics have quite a large blind spot when it comes to Apryse WebViewer. These platforms provide partial data on how users interact with the webpage, but there’s not really any data on how they interact with WebViewer (or the document) itself.
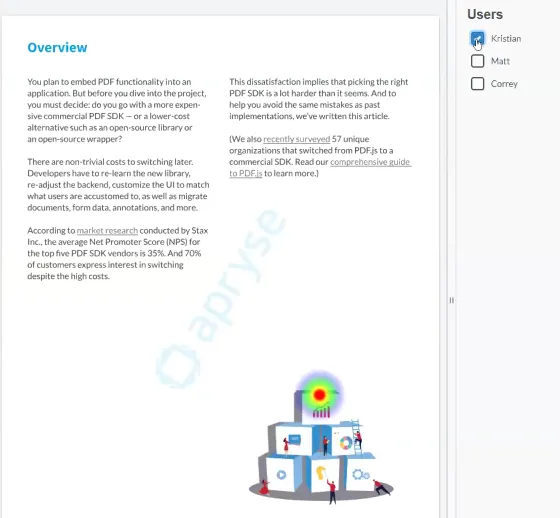
Here’s what current analytics platforms can see (highlighted in green):
Google Analytics could tell you which demo a user clicks on, or if they click on other page links in the header. But anything not highlighted in green? No data for you.
You could hook up a third-party SaaS platform like Hotjar for insights into what’s happening on the overall webpage, but these platforms tend to treat WebViewer as a static component, so any data it generates won’t be that useful.
It’s also possible to manually track some document interactions, but you’d have to build in that functionality yourself (which means a lot of time and money).
So, how can you know if your documents are truly useful? Apryse Analytics takes the stage. It tracks how users interact with WebViewer and the content, both in aggregate and on an individual basis. (If we were to update the image above based on what Apryse Analytics covers, the whole thing would be green.)
It’s not just a data collection tool, either. It’s an analytics data visualization web app that enables scalable, client-side dashboards. The interaction data can be visualized against the actual document content, which means WebViewer customers get way better insight on how their content is being consumed. Talk about striking a chord with users.
That Tracks: What Apryse Analytics Does
Now that we know the why, let’s jump into the demo and see what data Apryse Analytics provides.
Heatmap data: Tracks the user’s cursor and shows where they’re spending the most time on a page.
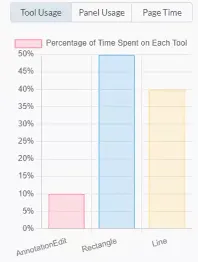
Tool usage: Tracks which WebViewer tools are being used, shown as a relative percentage of time spent in each tool.
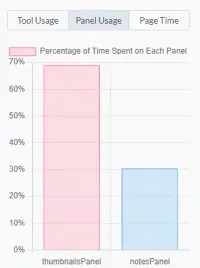
Panel usage: Tracks which panels in WebViewer, like the thumbnail and notes panels, are being used.
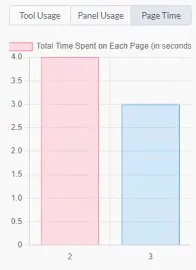
Time on page: Tracks the time spent on each page of the document, shown in seconds.
Click data: Shows what users are clicking in the document, like links and CTAs. It also shows any clicks in blank areas.
“Rage” clicks: Shows areas where people click multiple times in quick succession. This type of interaction is called a “rage click” because it usually indicates user frustration. For example, they think a component should be clickable and get annoyed when it’s not.
Interaction data segmented by user: Tracks the interactions of either one specific user or multiple users. It can also show aggregate data of all interactions by document or page.
Tell Me Why: The Benefits of Apryse Analytics
Now that we’ve got the ability to collect and visualize all this document interaction data, let’s look at who could benefit the most from it, and why.
Apryse Analytics is ideal for businesses in:
- Government
- Education
- Financial Services
- Insurance
- Legal
- Architecture, engineering, and construction
- Healthcare
Why these industries? Generally, companies working in these sectors either create or standardize the content that’s being used in their own platforms. They need insights into how materials are performing so they can make them better and easily test the effectiveness of any improvements.
Let’s look at a few Apryse Analytics benefits.
Optimization: Interaction data can help you optimize the layout of documents and CTA placements, ensuring your content is easy to navigate and high-performance.
Progress: Apryse Analytics can show how far users are getting through documents like contracts. If everyone stops reading in the middle of a document, that could indicate a serious problem with the content.
Security: Many of the industries listed above are subject to strict privacy legislation and compliance requirements. The Hackstreet Boys’ solution keeps all that customer analytics data on-premises, so there’s no need for third-party servers.
Budget: In addition to the risk of potential security vulnerabilities, separate third-party SaaS analytics solutions can be expensive. Adding analytics capabilities to WebViewer saves money and simplifies workflows.
What a useful and innovative tool! The Hackstreet Boys should definitely take a bow.
Mic Drop: Explore More WebViewer Features
Though the analytics functionality demonstrated in The Hackstreet Boys’ Innovation Days project is currently only in rehearsals, Apryse WebViewer does offer a ton of other cool document processing features. Head over to the showcase to try it yourself, or get in touch with our team. If you’d like to talk tech with our Solutions Engineers, you can find them on Discord.
Note: The projects covered here and in the other Innovation Days blog posts are not currently in product development. They are prototypes created specifically for this event. If you'd like to request the features you see here, you can fill out this form. Or, feel free to reach out to your CSM directly.
Tags
webviewer
analytics
security
UX

Nikki Manthey
Share this post


