Updated April 25, 2023
4 min
Refining Measurements with WebViewer 8.5

Related Products

We’re excited to announce version 8.5 of Apryse WebViewer - focused on revamping the measurement experience.
Our PDF measurement set was already reasonably robust as we serve many customers including leaders in the architecture, engineering, and construction industry. Nevertheless, we wanted to add more polish to align the overall user experience.
In this release, our collection of quality of life improvements include:
- Upgraded handling of object snaps
- Measurement of angles and arcs
- Improved experience when measuring highly detailed drawings and
- Improved measurement precision
On top of measurement enhancements, we also overhauled how we load image files for an average loading time improvement of 5x over previous versions.
Let’s dive in.
Visualize Objects Snaps
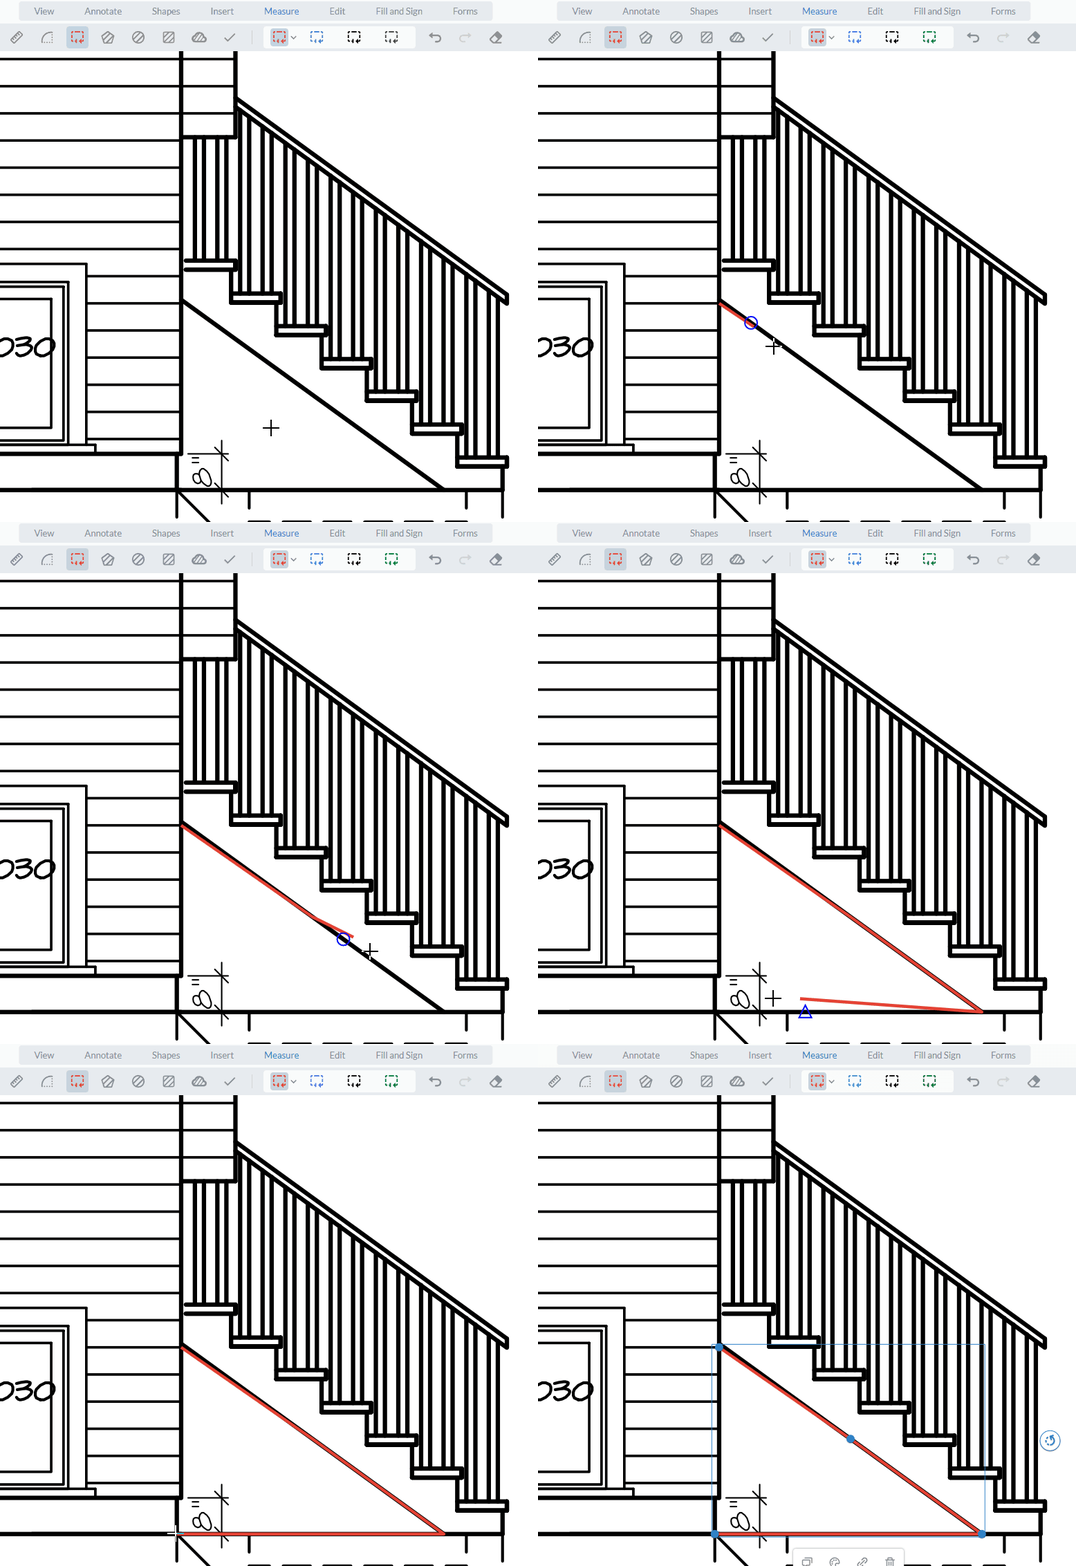
For quite some time, WebViewer had object snaps – the ability to snap measurement annotations to vector content in PDFs such as endpoints and midpoints. However, the experience wasn't always intuitive, as the UI did not communicate the type of point the user would snap to.
With version 8.5, WebViewer now shows a visual indication of the nearest object snap to let you quickly select the point you want. We designed the indicators to look like those in standard CAD programs. Out of the box, a square denotes an endpoint, a triangle means a midpoint, X is an intersection, and a circle is a point on a line.
The new indicators work across all our standard measurement tools, and as we're an SDK, you can customize indicators to your user's preference. You can edit the activation threshold, size, and color with the API.
Measure with Precision
The distance measurement tool is probably the most-used measurement feature in our set. And given how popular it is, we paid particular attention to it in this release.
We added lead lines by default. These make distance measurements stand off from the content you're measuring, so you can always see what is underneath. We also added a new handle so you can adjust the lead length to fit the situation.
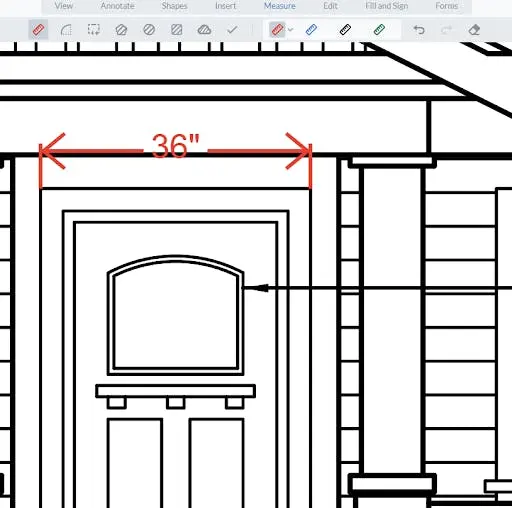
Lead lines ensure measurement doesn’t hide what is beneath
This new handle has another important use – adjusting the placement of measurement captions that give you the dimension of the line as you snap to it. Moving captions is especially useful for small measurements, where there often isn’t enough space to show captions inside the measurement line. You can set captions left, center, or right with the handle and configure the default via API.
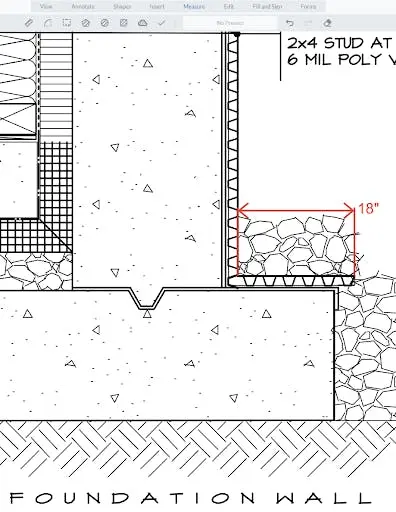
A measurement caption (18” above) set to the right of the measurement.
Finally, the distance tool arrow rendered with an occasional mismatch at very high zoom levels versus low magnification levels, so we tweaked how we draw distance measurements.
Measure Arcs and Angles with JavaScript
Another common request that we’ve heard loud and clear was the ability to measure curved lines. With the new arc measurement tool, now you can!
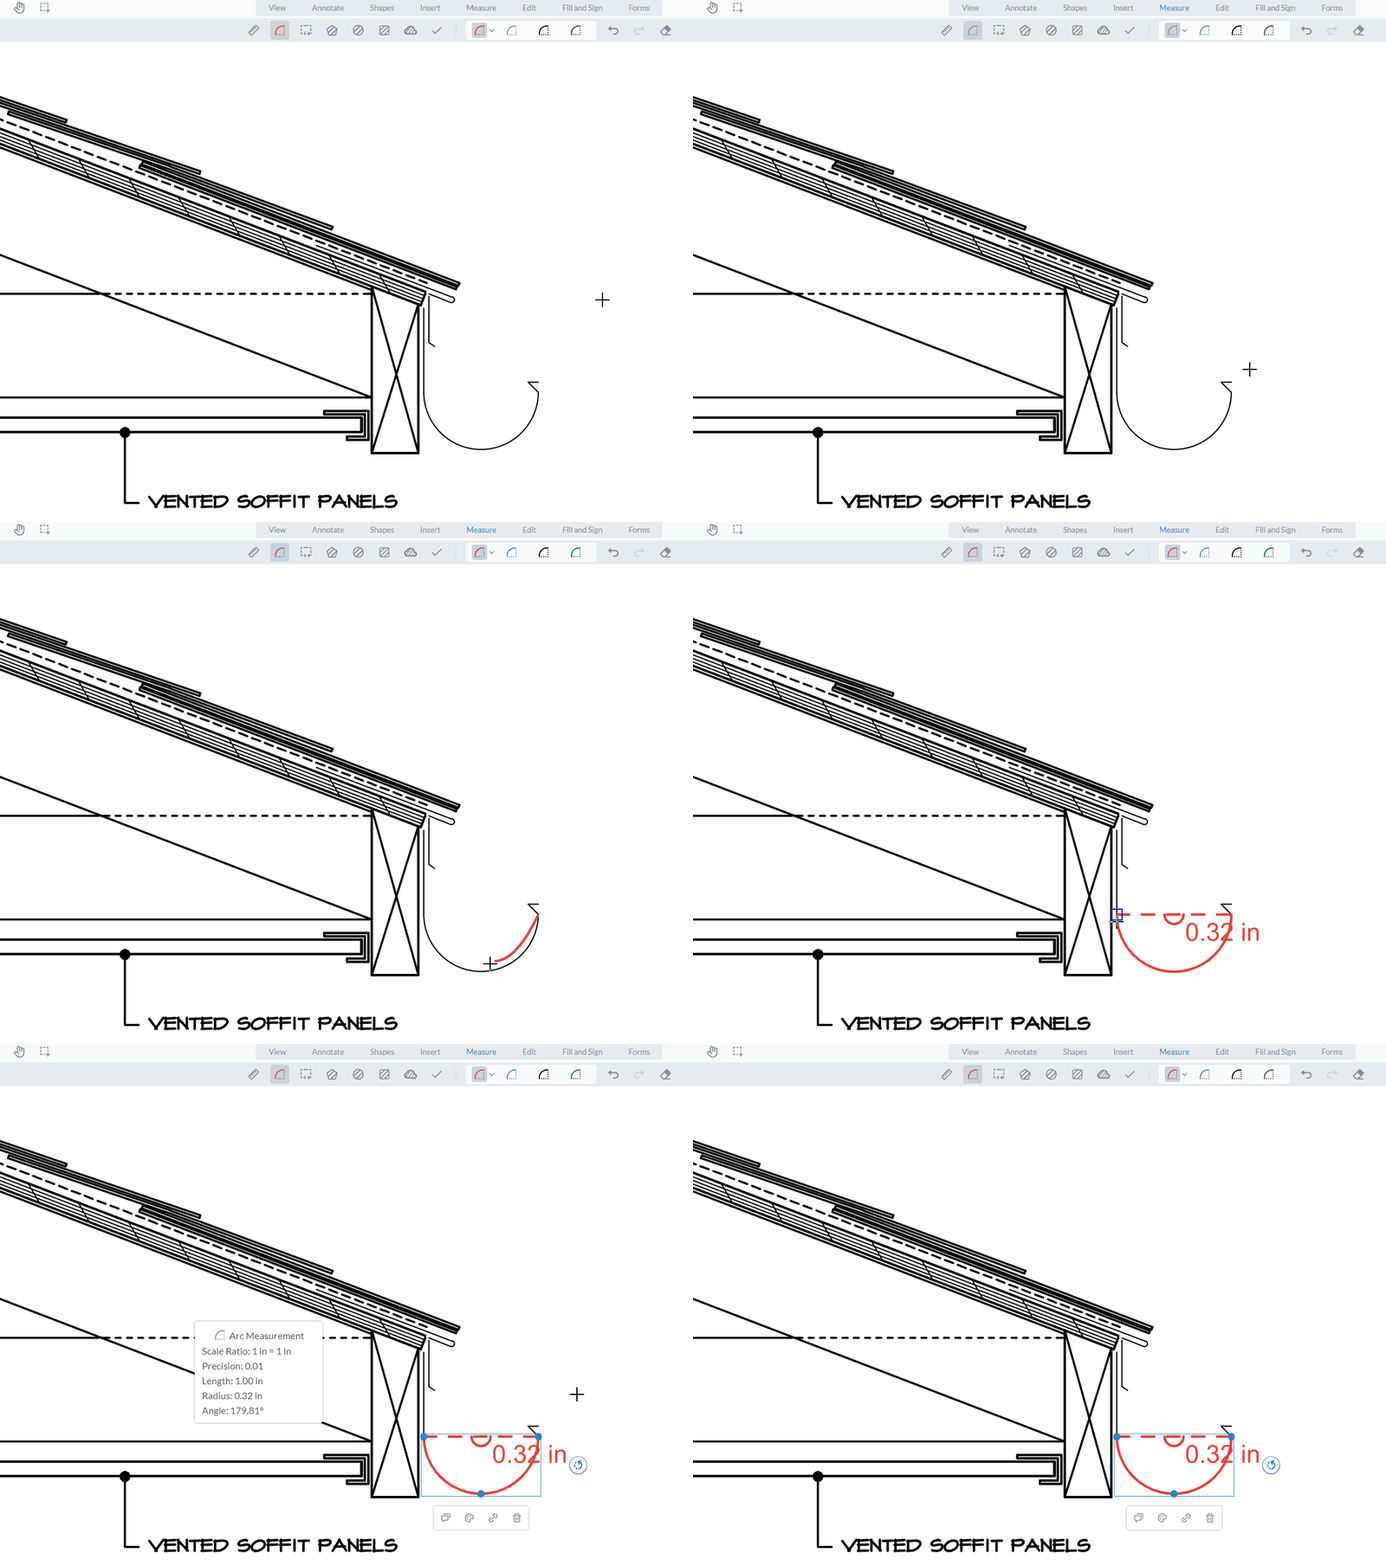
The arc tool lets you measure in three clicks – select a start point, a midpoint along the arc length, then the endpoint, and you’re done.
Not only will you get arc length; you get arc radius and the center angle as well.
A measurement caption (18” above) set to the right of the measurement.
The arc measurement also works with the new visual snap indicators, just like all our other measurement tools.
Measure Highly Detailed Drawings
Next, we focused on making measurement more precise and tool behavior better, particularly when it came to the most complex drawings where measurement is often performed.
We upgraded testing processes for our SDK with complex drawings, and we added a few new features and other touches for version 8.5.
For example, you can now reduce the stroke all the way down to 0.1 pts to get your measurements to just the right scale for the content being measured. For even more precision, you can also type in an exact stroke width.
In addition, we improved handling of shapes at high zoom levels, so they can be moved smoothly and easily.
Image Loading Improvements
Lastly, we rewrote how WebViewer handles the loading of image files.
Previously, we used the same APIs for parsing the image and drawing it on a canvas via a PDF worker. Now, however, we use native browser elements without a PDF worker for conversion.
Since we don’t need to wait on the worker to load first, images load up in a fraction of the time compared to the past. Check out the chart beneath to see the comparison in milliseconds (ms) of how long it takes images to display. (For reference, 300 milliseconds is as fast as an eye blink.)
No action is required on your end to take advantage of the new image loading performance. Just update your WebViewer to the latest version.
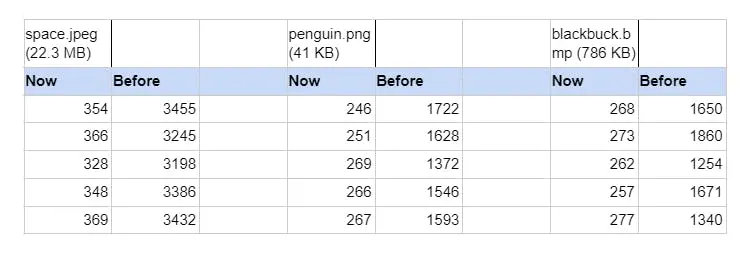
Image loading speeds (in ms) tested in WebViewer using Google Chrome.
Wrap Up
That’s a wrap on this release. We hope you enjoy these changes! As always, all feedback is welcome as we continue to fine-tune and expand our capabilities by bringing the changes that matter to you.
You can find the full changelog on our website. If you have any questions, feedback, or feature suggestions, please feel free to email me directly. Check out our measurement guides to learn more about WebViewer’s measurement functionality. And be sure to stay tuned for the next release!


