Apryse
Published July 24, 2026
Updated November 05, 2026

5 min


How to Measure PDF Extraction Accuracy on Your Own Docs
Apryse
Vendors each publish benchmarks showing they win, and none of them predicts how your documents will do. The score depends on what was tested: which documents, how long they were, scanned or born-digital, and what counted as correct. So run the test yourself. Collect real files from your own mix, messy ones included, and mark up the right answers by hand. Then measure three things. How many fields came back correct, counted per field, because one wrong total among forty right ones still breaks a reconciliation. How many documents came back usable with no human touch. And how many pages need a person to review them, because that is what you pay for at volume. Run every candidate on the same set, unchanged.
A benchmark is only meaningful if:
- The documents reflect real-world usage
- The evaluation criteria match practical needs
- The scoring method is transparent and fair
When a single metric becomes the only thing that matters, systems will optimize for that metric at the expense of real-world performance such as with the Volkswagen Dieselgate scandal, or using macOS to measure OCR when the intended deployment is to a Linux machine.
What Makes a Good Test Corpus (a collection of test documents)?
Designing a representative set of test documents is surprisingly difficult. Small decisions in corpus design can dramatically bias results.
1. Industry-Specific Variation
PDFs differ widely depending on their origin:
Industry | Typical document characteristics |
|---|---|
Forms, tables, scanned inputs | |
Dense text, citations, footnotes | |
Structured tables, reports | |
Drawings, diagrams, annotations | |
Publishing | Complex layouts, typography |
That’s a huge problem since a tool tuned for invoices will likely perform extremely well on financial data but fail badly on academic papers with multi-column layouts and embedded figures.
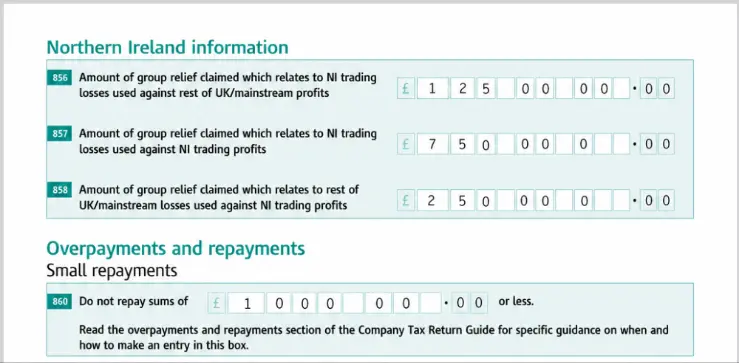
Figure 1 – Part of finance_136.pdf from the RealDoc-Bench corpus
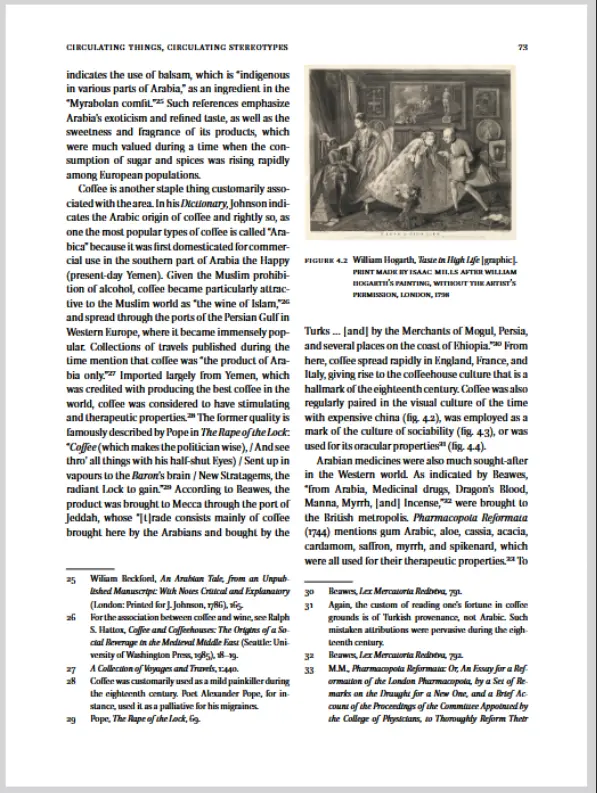
Figure 2 - A multi-column document with footnotes. 01030000000008.pdf from the dp-bench corpus.
It’s therefore difficult to create a single corpus that is meaningful for multiple industries.
2. Language Diversity
Many of the corpora use English language documents, and if that is your target audience then that’s fine. But what about if all or some of your market uses another language, whether a Latin-based language such as Spanish, or something entirely different such as Chinese or Thai?
Language affects not just the characters used, but also word boundaries (English uses spaces between words while Chinese does not), and text direction (Arabic reads right to left and Chinese and Japanese often read from top to bottom)
If your benchmark only includes English documents, you’re not measuring global performance.
3. A Mixture of Document Origin: Born-Digital vs. Scanned
Knowing how the sample documents were created matters:
Born-digital PDFs
- Clean text layer
- Often structurally consistent
Scanned PDFs
- Require OCR, or even ICR Handwriting recognition
- Include noise, skew, and artifacts (such as staples, holes and dog hairs) which need to be corrected before accurate data extraction can occur.
An error in OCR can lead to down-stream document structure misunderstanding. For example, misidentifying a “1” as “I” could mean that a page number is not identified, which could then result in a footer not being detected. An updated OCR engine such as PaddleOCR could result in significant improvement in structure data extraction, even if nothing else in the library changes.
A benchmark that excludes scanned documents can dramatically overestimate real-world accuracy.
Whether that is a problem depends, once again, on what you or your customers need.
4. A Mixture of Tagged vs. Untagged PDFs
A well-tagged PDF includes structural metadata that identify parts of the PDF as (for example):
- Headings
- Paragraphs
- Tables
Some PDF libraries leverage that information to increase accuracy, others don’t. That can make the difference between a table actually being detected as a table rather than as just text.
With the introduction of Accessibility legislation (such as the European Accessibility Act), newly created documents are increasingly likely to use tagging so they meet PDF/UA. That’s great news for the less able.
Many of the publicly available corpora have a high proportion of PDFs that were collected ten or more years ago. As a consequence, they are disproportionately biased towards untagged documents.
If your test set uses only tagged PDFs, then some SDKs might give far better results than users would experience with a set of older, untagged, documents.
On the other hand, if the test set just uses untagged PDFs, then it may bias the results towards less sophisticated tools, which give worse results than other libraries with modern, tagged, documents.
5. Realistic Document Complexity
PDFs can, of course, represent just about anything that can be printed.
They could be a half a page long, or hundreds of pages long
- They could be simple text, or multi-column layout
- They could have a range of page sizes and orientations
- They might just have text, or they might contain tables, list items, images, captions, headers footers, footnotes
Each of these introduces opportunities for extraction errors. The longer the document the more opportunity there is to go wrong.
Short is simple, but very often it is not representative of real-world documents.
A benchmark that uses just single page documents, arguably has no real world value.
6. Realistic Document Length
Having realistic original documents is one thing, but length of a sample file is another.
Many corpora contain files that are just single pages taken from a multi-page PDF. That makes life simple (as we saw with short documents), but it has more subtle effects too. If you only have a single page taken from a larger document, then the data extraction library cannot use context from surrounding pages (since they have been removed).
As a result:
- Headers, footers and page numbers (which are often repeating patterns on multiple pages) are harder to detect
- Tables split over multiple pages cannot be reconstructed as a single table
- A table of contents cannot have valid links to parts of the document that are on other pages
That favors tools that read one page in isolation and penalizes tools that use the surrounding pages.
Corpora built from single pages are therefore of limited value for testing the long documents you process.
A further problem with testing against single page documents is that it gives you no idea whether the tool can work with real, longer documents.
A tool with poor memory management might work well with a single page document but run out of memory, or slow down dramatically, when faced with a 50 page business report?
7. Publicly Shareable Files
A corpus the vendor won’t share can’t be checked by anyone else.
But not all files can be shared. They might
- Contain PII
- Not be licensed for sharing
- Contain confidential customer data.
Creating a corpus of documents that is realistic, and shareable, is therefore extremely hard.
8. The Right Number of Sample Files
Finally, the sample set should be large enough to cover a range of scenarios that you care about, but small enough that it can be run quickly.
Ultimately there is no point having 400 PDFs that are essentially the same. That just makes testing slow (and gives a lot of data to review).
But for a general corpus there is a good reason to have a mix of PDFs from different industries, with both scanned and born digital files. Typical corpus size for benchmarking is around 200 files, which is probably a good (and understandable size). However, some corpora have several documents that are single pages taken from the same original PDF, and likely are not testing anything different.
Corpus creation is therefore extremely complex, with a large number of trade-offs if a “One size fits all” corpus is required.
It is one reason why you should use benchmark data only as a starting point and then test with your own documents.
Knowing which files to test is only part of the problem when comparing different vendors. You also need to be able to compare the outputs to work out which one gives the best results.
Output Formats: Comparing Apples to Apples
Not all libraries produce the same output:
- Some generate Markdown
- Others such as Apryse output JSON, and others output XML
These formats are not equivalent.
For example, let’s consider this page from a PDF:
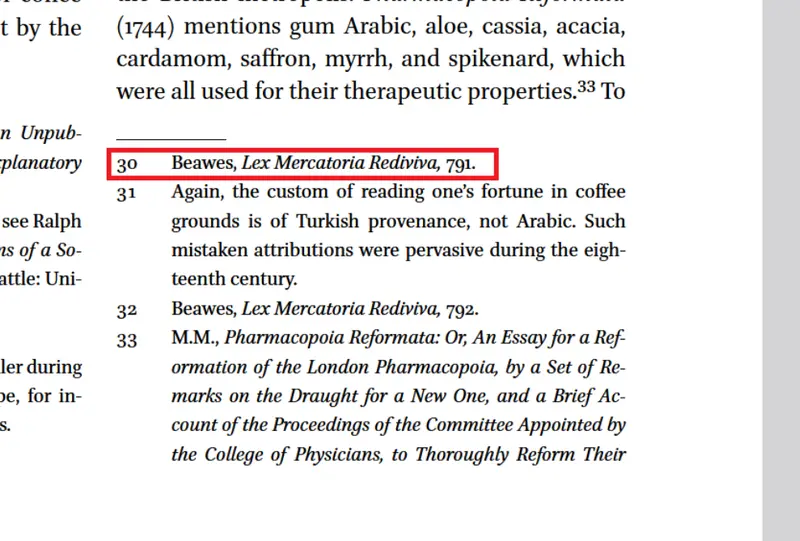
Figure 3 - part of a page from a PDF showing a footnote
Markdown output for the text within a footnote would be simple text.
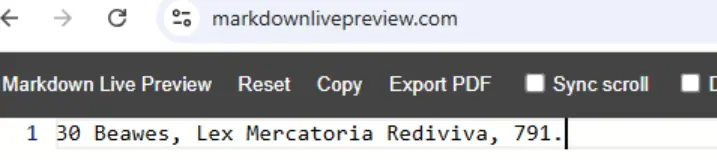
Figure 4 - Markdown output for a footnote. You now need to work out that it was footnote, rather than say a street address.
Whereas JSON output could contain information about location and font size:
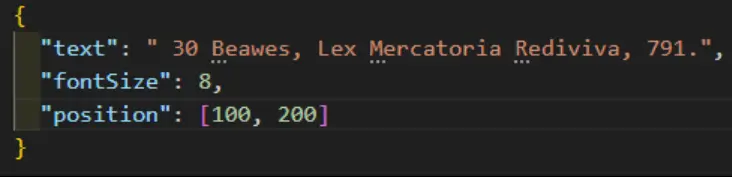
Figure 5 - simple JSON output that includes the location and size of the footnote text.
Or even with more information about being a footnote, or italic etc.
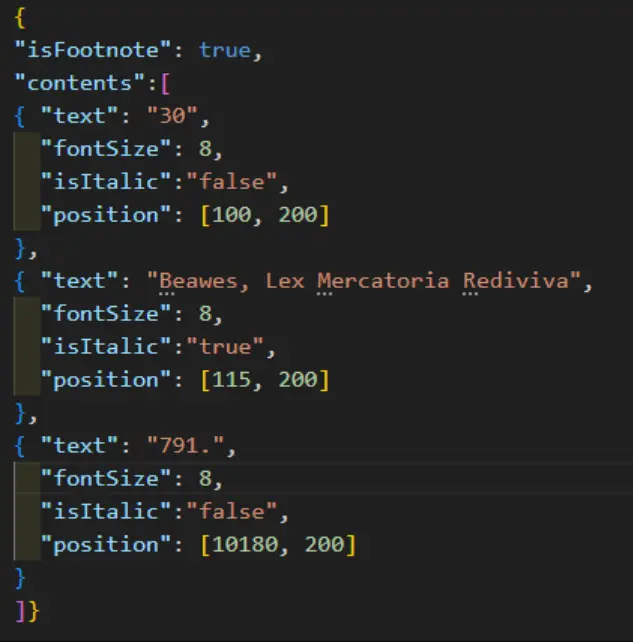
Figure 6 - A version of JSON output that identified the text as a footnote, and records which text was in italics.
All of these outputs are “true”, but some contain structural information that is lost elsewhere (particularly when exporting to markdown).
Ultimately, the ‘Correct” answer depends on which one solves the user’s particular problem. Markdown might be good enough, or the discarded information might be a showstopper.
This makes direct comparisons between tools inherently difficult, and it gets harder.
What Is Truth, Anyway?
To measure accuracy, you need a ground truth. But PDFs are fundamentally ambiguous.
Sometimes there is a single, obvious way to evaluate what the content of a PDF and the correct reading order is. On other occasions that is not the case. Consider one of the files (which I chose at random) from a public benchmark corpus.
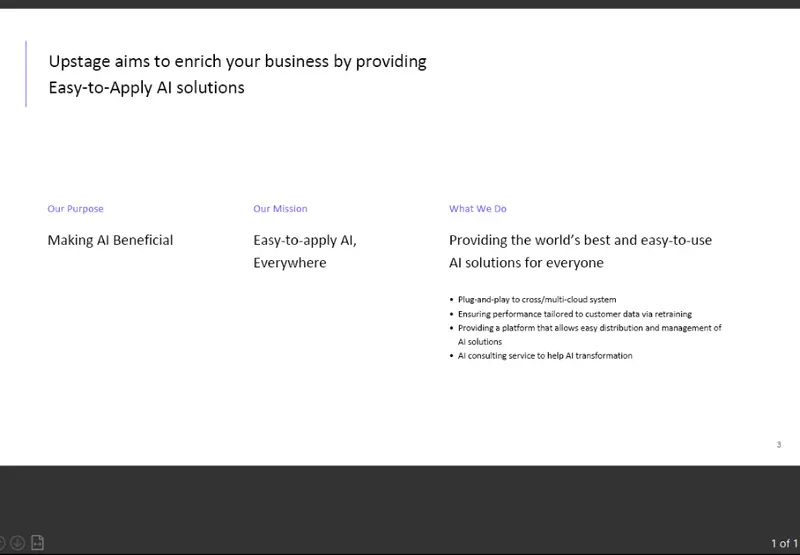
Figure 7 - 01030000000181 from the DP-Bench dataset. The content could be considered to be tabbed data (unlikely), columns (possible) or a table (maybe).
- Is the vertical graphic solely for aesthetics or does it imply something? Should it be ignored or included in the output. Is it even the number “1”?
- Is this a table or multi-column, or even tabbed text. If it’s a table are the bullet points in the same row, or all in a separate row, or in many separate rows?
- Does the number “3” at the bottom right indicate a page number, or a reference to something else (bearing in mind that this is a single page document)?
Similarly, reading order of a PDF can be ambiguous.
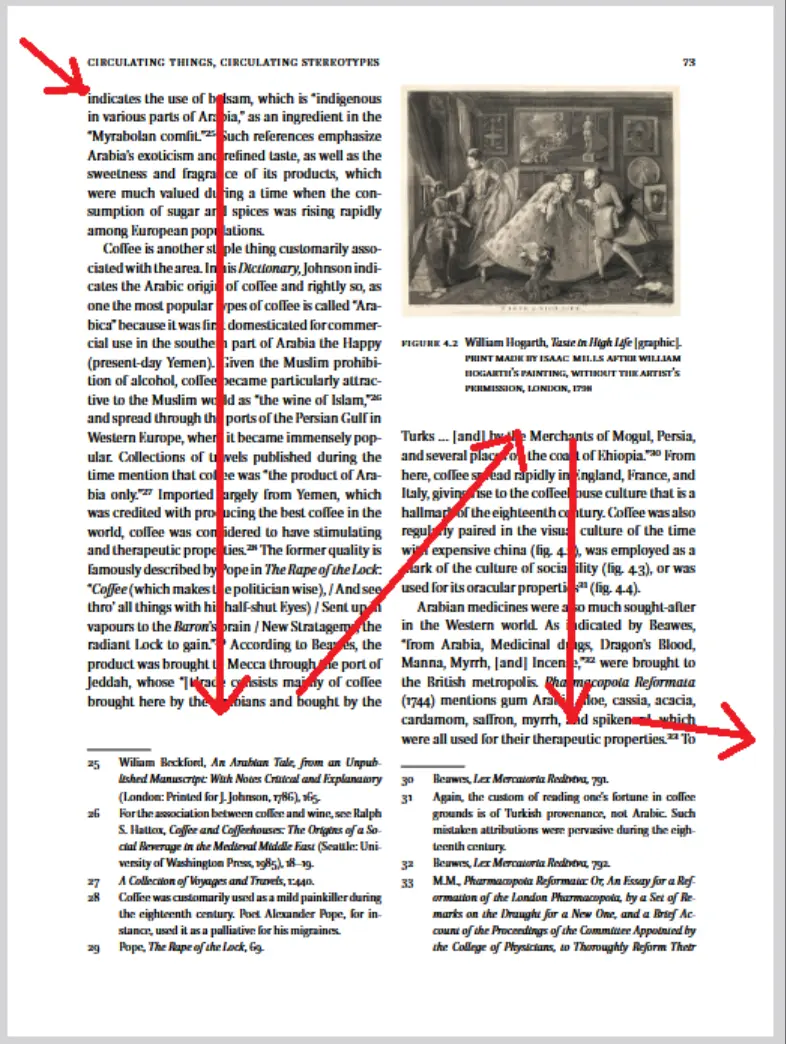
Figure 8 - For a multi-column document with footnotes, where do the footnotes go in the reading order - many people would ignore them.
As a human I would probably read most of the first column, then jump to a footnote, then look at the image, then go back to the first column, then onto the second column, jump to a footnote, spot that there is another footnote that is from the same source, then go back to the text.
But if I was to read the document again then I would likely do something different.
And should the footnotes for the first column, if we include them at all, go after the first column’s text, or after all of the text?
Similarly, if there is a footer, then I would probably skip over the footer, but only if I recognize it as a footer.
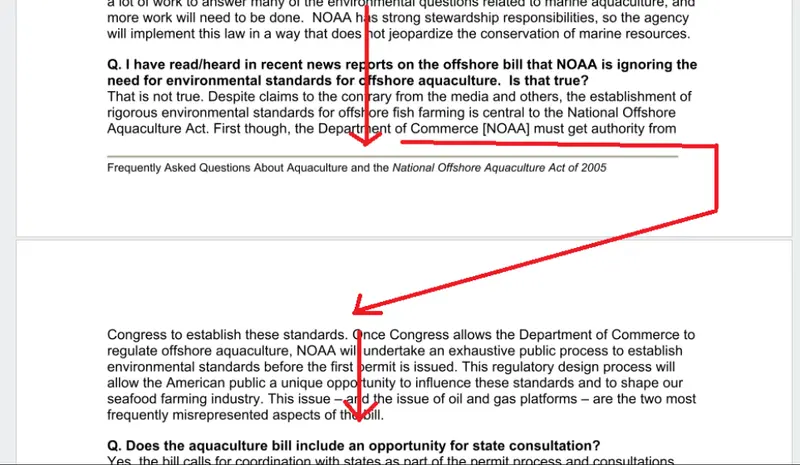
Figure 9 - If a footer is present then generally the reading order would not include it
Creating “Ground truth” is therefore hard.
Even if the “truth” is non-ambiguous generating it is tedious.
It’s almost certainly one of the reasons why many benchmark corpora use single page documents.
Three Numbers to Score on Your Own Documents
Once you have your answer key, score every candidate on the same three numbers:
Field Accuracy
Mark each field you asked for as right or wrong. Count per field, not per document. Say you run 200 invoices with 40 fields each. That is 8,000 fields, and a tool that gets 7,960 right scores 99.5 percent. If the 40 misses are the invoice total on 40 different invoices, 40 invoices fail reconciliation. Score the fields that matter most, such as totals, dates and ID numbers, as their own group.
Usable Documents
Count the documents that came back fully usable with no human touch. A document passes only if every field you need is right. In the invoice example, 160 clean documents out of 200 is 80 percent, even though field accuracy looks like 99.5 percent. Report both numbers side by side.
Pages Needing Review
Count the pages a person has to check, and divide by all the pages you ran. This is the cost at volume. A tool that sends 5 percent of pages to review means 50,000 reviewed pages for every million you process. Record why each page went to review, such as a low confidence score, a poor scan or a table that broke across pages.
In the next article we will look at how Apryse created a publicly available corpus for benchmarking Smart Data Extraction.
Need Help?
If you have questions or want to discuss benchmarking strategies, reach out via our https://apryse.com/discord or email blog-feedback@apryse.com.